ORIGINAL
HEAT MAP
VISUAL METROLOGY
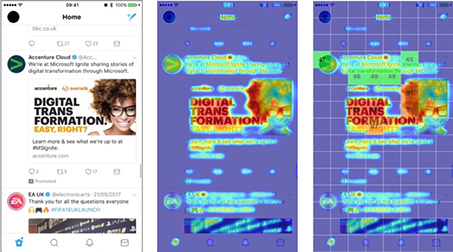

While the Dragonfly solution can analyse visual content and output relevant saliency maps and scores, it requires human (user) interaction to validate and interpret these outputs in the context of the objectives for the task in hand.
The solution predicts the areas and elements that are likely to attract attention at first glance, to provide end users such as designers, marketers, and anyone involved in visual communication with objective and unbiased metrics they can use to make their own informed decisions.
The solution does not optimise or change the original content in any way or provide explicit recommendations to the user.
We train users to view Dragonfly results along with project’s visual priority elements in mind as described below.
After running an analysis, does the Dragonfly output predict that the priority elements are achieving high saliency scores and will attract attention? If so, then the outputs can be confidently used to help validate the recommended creative. If not, check what other areas or elements are predicted to attract attention (or potentially distracting viewers)? If these are not aligned with your visual priority objectives, can any of the elements be changed or modified to rectify these (potential) issues.
With consumers in a hurry and dozens of visual brand messages competing for their time, catching the eye is crucial. Dragonfly replicates how the human eye actually works so you can make sure your marketing stands out from the crowd.
Dragonfly provides instant real-time analysis of the creative assets you are looking at, revealing ‘hot and cool’ spots. You can use it to analyse anything you can view on a tablet, from print and live digital assets, to packaging, retail space and out-of-home advertising.
Dragonfly uses a computational model to process the visual characteristics of what someone is looking at (orientation, scale, contrast, texture, luminance) to assign a stimulus attention score to every pixel, demonstrating its attractiveness. The resulting outputs are heat maps that display what grabs human attention in the first 2-3 seconds of interaction.
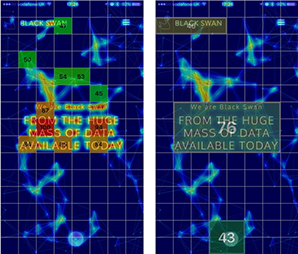
The following examples contain a heat map as well as a heat map containing the saliency scores. The scores in red immediately show you the top five areas of highest saliency within that visual, allowing you to see which areas of the visual are performing best from a saliency point of view. The scores in green are the mean scores and these areas are most likely NOT going to be seen in the first five seconds.
ORIGINAL
HEAT MAP
VISUAL METROLOGY
Provides an instant view of where customers’ eyes are most drawn on the image or content.
This can be used to improve UI/UX and draw customers’ eyes to key focus areas of your choosing
Accurately measure areas of attention quantitatively and how they compare against key focus areas relevant for you campaign.
An interactive layer enables the user to surface the saliency values of any areas across the image
Saliency Identifier is the primary analysis we run, this help us determine:
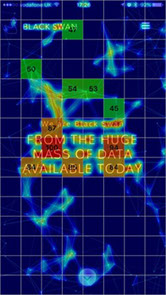
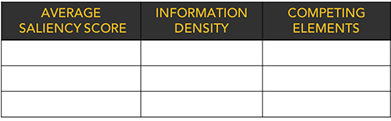
The saliency average values indicated by the green squares in general is the range for the mean average values. The aim is to keep the average value around the 50 mark, this will indicate that there is a medium information density and some competing elements that immediately grabs the viewers attention in the content view.
The relative average value range is an important metric to identify the information density of the image collectively. This can help determine if the image is too cluttered with too many competing elements.
If the average range is high, this means there is too much information in the image with many competing elements and has a low probability of individual elements to stand out and attract attention.
Visual Priority is the relative probability of attracting viewers attention.
We can establish the visual priority of key elements we are interested in analysing by looking at the the saliency scores in relation to the each other across the image
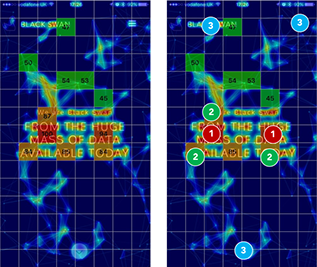
Each of the key elements are clustered to determine the average saliency scores.
This is then compared against other elements and also against the relative benchmark average range.
Dragonfly simulates the bottom up processing approach to how we as humans perceive visual information, this phase of vision happens when we first glance at something, but before we are aware of what we are looking at. Bottom up processing is biological process that is universal across all humans, regardless of their demographic such age, race, religion, gender, family size, ethnicity, income, and education.
Behaviour research has shown that human attributes such as gender, age, or experience have little effect on where people will initially look (assuming equivalent visual acuity and other visual processing capabilities). However, once the visual system has completed the initial surveillance process (usually 2–3 seconds), 'top-down' processing influences related to personal interest, experience and task will play a more significant role in where people will look.
Dragonfly predicts visual attention for an average observer with a free viewing task by filtering input image into a number of low-level visual “feature channels” found in visual cortex. By free viewing we mean to imitate situations in which observers are viewing their world without a specific goal.
The Dragonfly model looks at several visual elements that decades of science have proven attract our first glance attention, including Edges, Intensity, Red/Green Colour Contrast, Blue/Yellow Colour Contrast, Texture, orientation and scale etc
While the Dragonfly solution can analyse visual content and output relevant saliency maps and scores, it requires human (user) interaction to validate and interpret these outputs in the context of the objectives for the task in hand.
Dragonfly predicts the areas and elements that are likely to attract attention at first glance, to provide end users such as designers, marketers, and anyone involved in visual communication with objective and unbiased metrics they can use to make their own informed decisions.
The solution does not optimise or change the original content in any way or provide explicit recommendations to the user.
We always recommend users to view Dragonfly outputs and results with the priority of the visual elements in mind. After running your analysis, does the Dragonfly output predict that the priority elements are achieving high saliency scores and will attract attention? If so, then the outputs can be confidently used to help validate the recommended creative. If not, check what other areas or elements are predicted to attract attention (or potentially distracting viewers)? If these are not aligned with your visual priority objectives, can any of the elements be changed or modified to rectify these (potential) issues.
When looking at your priority elements, consider identifying up to 5 key visual elements you would like to prioritise to attract the most attention. What priority should these be in order of importance to the objective and how can you optimise your content to increase the saliency of these elements individually and collectively within the scene. For example, use an element with high saliency to attract attention, and place it near important copy, calls to action, etc to maximise the opportunity you priority element will get noticed.
Dragonfly can indicate which elements that will attract attention when viewing on-screen digital content, individual product packs, POS and indoor and outdoor signage etc under forced exposure
Dragonfly should not be used as an alternative to a full eye tracking study that tracks a person’s gaze. However, Dragonfly can be used to help validate content and stimulus for testing with eye tracking studies.
Dragonfly does not predict Post Attentive vision.
Dragonfly does not predict if people will remember and comprehend with what they are looking at, or consider or engage with a marketing message within the image.
Dragonfly only replicates what grabs visual attention when there are no other environmental distractions.
Dragonfly cannot predict what a viewer will engage with on a website or a whole retail fixture as they will be influenced by mission, brand loyalty, level of planning, category pre-disposition, price & promo sensitivity etc