HEAT MAP VIEW

OPACITY MAP VIEW
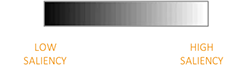

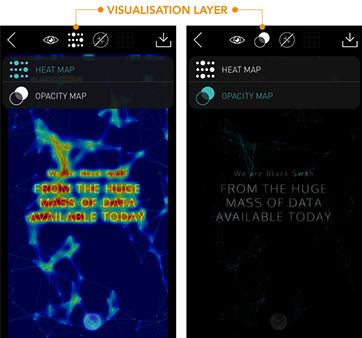
Dragonfly analyses any image based content through model and outputs a heat-map (saliency map) in the Visualisation layer. This provides a instant view of the high and low saliency areas within the image.
The solution also displays the metrics behind the heat maps in the Analysis layer. Here you can view the saliency scores (between 0-100) and run further detailed analysis of your content
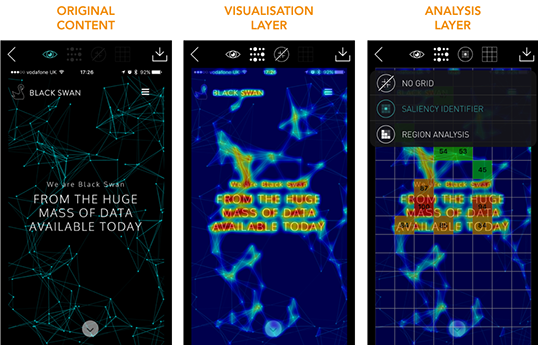
Upon selecting an image for analysis the app will automatically run the Dragonfly analysis and display a heat map output
You can toggle between the original and Dragonfly analysis versions anytime using the ‘Original View’ option
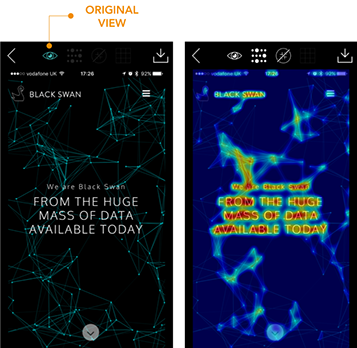
The Visualisation option provides 2 types of saliency metrics outputs:
HEAT MAP VIEW
OPACITY MAP VIEW
The Analysis Type option provides the following:
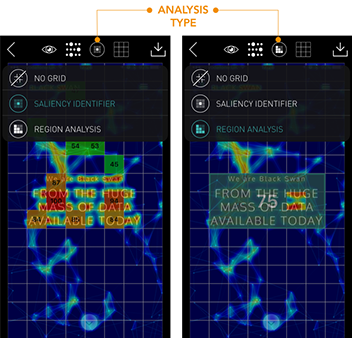
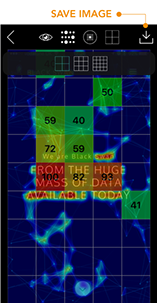
The Saliency identifier view calculates the top 5 areas with the highest saliency in the image indicated by the red squares. The model also calculates the relative average mean saliency value range of the entire image and displays these as green squares. The scores in red immediately show you the top five areas of highest saliency within that visual, allowing you to see which areas of the visual are performing best from a saliency point of view. The scores in green are the mean scores and these areas are most likely NOT going to be seen in the first five seconds.
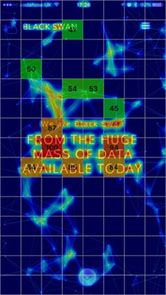
You can also select all the other remaining squares to view the saliency scores.
This enables you to compare the saliency scores of your key priority elements against the the high saliency areas determined by the model. This can help you to determine the visual saliency hierarchy of elements within the image.
The Region Analysis view enables you to select and create you own custom areas for analysis. The app will automatically merge the selected the area together and calculate the average saliency value of the defined region. You can create multiple regions for comparative analysis.
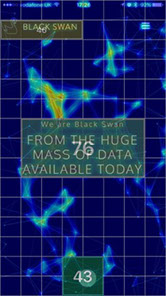
To create a region, tap on the grid to select a square, any further squares you select will expand the region you define.
To delete a region, you can individually tap each of the squares already defined or tap and hold the region you wish to delete.
To add an additional region:
Based on a grid framework, Dragonfly analyses the content in each square and calculates the average saliency value relative to other content in the creative
Dragonfly provides a number of grid densities depending on the density of visual elements the user would like to analyse.
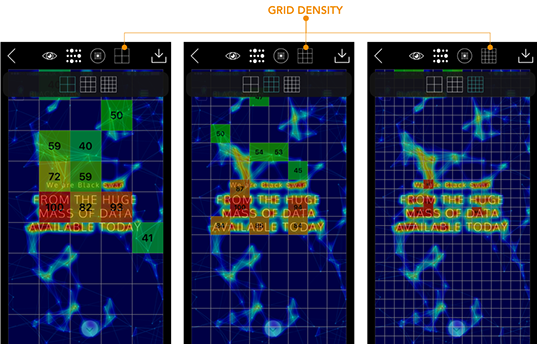
To be used when analysing images with fewer and larger visual elements
Default option that caters for most visual elements
To be used for more detailed analysis of visual elements that may be much smaller in size
The Save Image option will save a copy of the image to the device’s camera roll in the Photos app
Dragonfly will also automatically create a ‘Dragonfly’ album in the Photos App and save a copy of the image in the album